Source
Year
2023
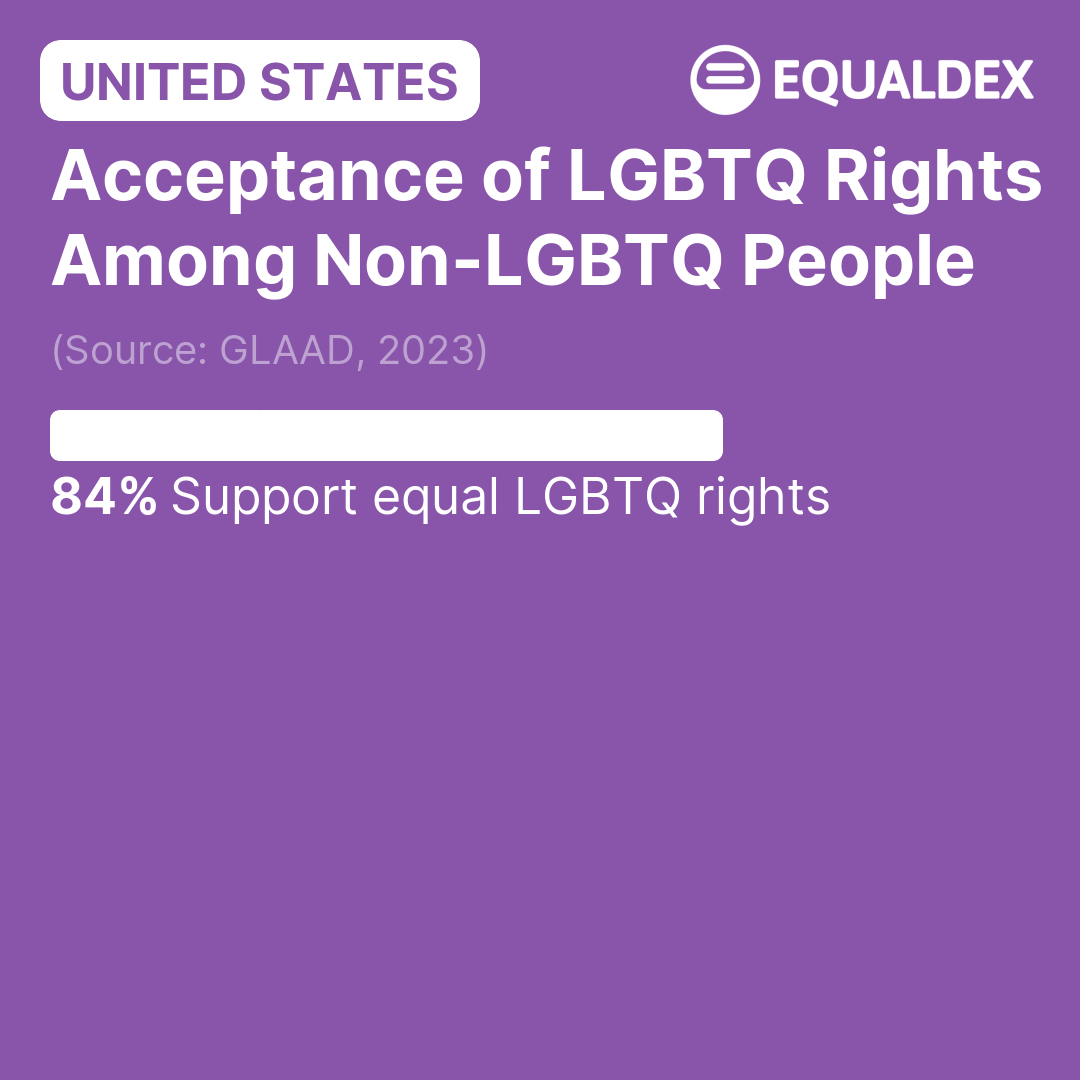
 United States: Acceptance of LGBTQ Rights Among Non-LGBTQ People
Submitted by danlev
Impact on the Equality Index
| Score | 84 / 100 |
| Weight | 100 / 100 |
| Time decay factor (3 years) | 0.5625 (0.752) |
| Adjusted weight (after time decay) | 56.3 / 100 |
More United States Public Opinion Surveys
Would you support or oppose the following? Banning transgender athletes from participating in women’s sports
(The Economist / YouGov, 2025)
Do you favor or oppose President Trump’s order requiring federal agencies to recognize only biological sex and remove gender identity from policies and documents?
(Marquette University Law School, 2025)
Percentage of U.S Adults Who Identify as a Sexual Orientation Other Than Heterosexual
(NBC News Stay Tuned, 2025)
Do you agree or disagree with the following statement: there are only two genders, male and female.
(NBC News Stay Tuned, 2025)
